Selina Concise Mathematics class 7 ICSE Solutions – Data Handling
Selina Concise Mathematics Class 7 ICSE Solutions Chapter 21 Data Handling
Selina Publishers Concise Mathematics Class 7 ICSE Solutions Chapter 21 Data HandlingData Handling Exercise 21A – Selina Concise Mathematics Class 7 ICSE Solutions
Question 1.
Consider the following numbers :
68, 76, 63, 75, 93, 83, 70, 115, 82, 105, 90, 103, 92, 52, 99, 73, 75, 63, 77 and 71.
(i) Arrange these numbers in ascending order.
(ii) What the range of these numbers?
Solution:
(i) When the above data are written in ascending order. We get,
52, 63, 63, 68, 70, 71, 73, 75, 75, 76, 77, 82, 83, 90, 92, 93, 99, 103, 105, 115
(ii) Range of given numbers = Largest number – Smallest number
= 115-52 = 48
Question 2.
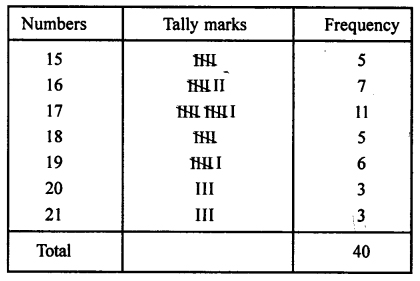
Represent the following data in the form of a frequency distribution table :
16, 17, 21, 20, 16, 20, 16, 18, 17, 21, 17, 18, 19, 17, 15, 15, 19, 19, 18, 17, 17, 15, 15, 16, 17, 17, 19, 18, 17, 16, 15, 20, 16, 17, 19, 18, 19, 16, 21 and 17.
Solution:
The frequency distribution for these data will be as shown below :Question 3.
A die was thrown 20 times and following scores were recorded.
2, 1, 5, 2, 4, 3, 6, 1, 4, 2, 5, 1, 6, 2, 6, 3, 5, 4, 1 and 3.
Prepare a frequency table for the scores.
Solution:
The frequency table for the scores will be as shown below :
Question 4.
Following data shows the weekly wages (in ₹) of 10 workers in a factory.
3500, 4250, 4000, 4250, 4000, 3750, 4750, 4000, 4250 and 4000
(i) Prepare a frequency distribution table.
(ii) What is the range of wages (in ₹)?
(iii) How many workers are getting the maximum wages?
Solution:
(i) The frequency table for the wages of 10 workers will be as shown below :
(ii) Range of wages (₹) = ₹4750 – ₹3500 = ₹1250
(iii) One
Question 5.
The marks obtained by 40 students of a class are given below :
80, 10, 30, 70, 60, 50, 50, 40, 40, 20, 40, 90, 50, 30, 70, 10, 60, 50, 20, 70, 70, 30, 80, 40,20, 80, 90, 50, 80, 60, 70, 40, 50, 60, 90, 60, 40, 40, 60 and 60
(i) Construct a frequency distribution table.
(ii) Find how many students have marks equal to or more than 70?(iii) How many students obtained marks below 40?
Solution:
(i) The frequency distribution table will be shown as below :
(ii)Students have marks equal to or more than 70 = 5 + 4 + 3 = 12
(iii) Students obtained marks below 40 = 2 + 3 + 3 = 8 students
Question 6.
Arrange the following data in descending order:
3.3, 3.2, 3.1, 3.7, 3.6, 4.0, 3.5, 3.9, 3.8, 4.1, 3.5, 3.8, 3.7, 3.9 and 3.4.
(i) Determine the range.
(ii) How many numbers are less than 3.5?
(iii) How many numbers are 3.8 or above?
Solution:
Descending order : 4.1, 4.0, 3.9, 3.9, 3.8, 3.8, 3.7, 3.7, 3.6, 3.5, 3.5, 3.4, 3.3, 3.2, 3.1
(i) Range = 4.1 – 3.1 = 1
(ii) Number less than 3.5 = 4
i.e., 3.4, 3.3, 3.2, 3.1
(iii) Number are 3-8 or above = 6
i.e., 3.8, 3.8, 3.9, 3.9, 4.0, 4.1
Data Handling Exercise 21B – Selina Concise Mathematics Class 7 ICSE Solutions
Question 1.
Find the mean of 53, 61, 60, 67 and 64.
Solution:
Mean of 53, 6i, 60, 67 and 64
Question 2.
Find the mean of first six natural numbers.
Solution:
First six natural numbers are : 1, 2, 3, 4, 5, 6
Question 3.
Find the mean of first ten odd natural numbers.
Solution:
First ten odd natural numbers are 1, 3, 5, 7, 9, 11, 13, 15, 17, 19
Question 4.
Find the mean of all factors of 10.
Solution:
The factor of 10 are 2 and 5
Question 5.
Find the mean of x + 3, x + 5, x + 7, x + 9 and x + 11.
Solution:
Mean of x + 3, x + 5, x + 7, x + 9 and x + 11
Question 6.
If different values of variable x are 19.8,15.4,13.7,11.71,11.8, 12.6,12.8,18.6,20.5 and 2.1, find the mean.
Solution:
19. +15.4 +13.7 +11.71 +11.8 +12.6 + 12.8 +18.6 + 20.5 +21.1Question 7.
The mean of a certain number of observations is 32. Find the resulting mean, if each observation is,
(i) increased by 3
(ii) decreased by 7(iii) multiplied by 2
(iv) divided by 0.5
(v) increased by 60%
(vi) decreased by 20%
Solution:
Question 8.
The pocket expenses (per day) of Anuj, during a certain week, from monday to Saturday were ₹85.40, ₹88.00, ₹86.50, ₹84.75, ₹82.60 and ₹87.25. Find the mean pocket expenses per day.
Solution:
The pocket expenses (per day) during a certain week are : ₹85.40, ₹88.00, ₹86.50, ₹84.75, ₹82.60 and ₹87.25∴Anuj expenses per day = ₹85.75
Question 9.
If the mean of 8, 10, 7, x + 2 and 6 is 9, find the value of x.
Solution:
The mean 8, 10, 7, x + 2 and 6 is 9
Question 10.
Find the mean of first six multiples of 3.
Solution:
The six multiples of 3 are 3, 6, 9, 12, 15, 18
Question 11.
Find the mean of first five prime numbers.
Solution:
The first five prime numbers are 2, 3, 5, 7, 11
Question 12.
The mean of six numbers :x-5,x- 1, x, x + 2, x + 4 and x + 12 is 15. Find the mean of first four numbers.
Solution:
The mean of six numbers are x – 5, x – 1,x,x + 2,x + 4 and x + 12 is 15Question 13.
Find the mean of squares of first five whole numbers.
Solution:
First five whole numbers are 0, 1, 2, 3, 4
Then square the whole prime numbers
Question 14.
If the mean of 6, 4, 7, p and 10 is 8, find the value of p.
Solution:
The mean of 6, 4, 7, p and 10 is 8
Question 15.
Find the mean of first six multiples of 5.
Solution:
Six multiples of 5 are :
5, 10, 15, 20, 25 and 30
Question 16.
The rainfall (in mm) in a city on 7 days of a certain week is recorded as follows
Find the total and average (mean) rainfall for the week.
Solution:
The rainfall in a city on 7 days are 0.5, 2.7, 2.6, 0.5, 2, 5.8, 1.5
The mean of marks scored by 100 students was found to be 40, later on it was discovered that a score of 53 was misread as 83. Find the correct mean.
Solution:
Mean of 40 observations = 100Total sum of 40 observations = 100 × 40 = 4000
Incorrect total of 40 observation is = 4000
Correct total of 40 observations = 4000 – 83 + 53 = 3970
∴ Correct mean =
 = 39.70
Question 18.
The mean of five numbers is 27. If one number is excluded, the mean of remaining numbers is 25. Find the excluded number.
Solution:
Mean of 5 observations = 27Total sum of 5 observations = 27 × 5 = 135
On excluding an observation, the mean of remaining 6 observations = 25
⇒ Total of remaining 4 observations = 25 x 4 = 100
⇒ Included observation = Total mean of 5 observations – Total mean of 4 observations
= 135- 100 = 35
Question 19.
The mean of 5 numbers is 27. If one new number is included, the new mean is 25. Find the included number.
Solution:
Mean of 5 observations = 27Total sum of 5 observations = 27 x 5 = 135
On including an observation the mean of 6 observation = 25 x 6 = 150
⇒ Included observations = Total Mean of 6 observations – Total mean of 5 observations = 150- 135 = 15
Question 20.
Mean of 5 numbers is 20 and mean of other 5 numbers is 30. Find the mean of all the 10 numbers taken together.
Solution:
The mean of 5 number = 20Then, mean of other 5 number = 30
Question 21.
Find the median of:
(i) 5,7, 9, 11, 15, 17,2, 23 and 19
(ii) 9, 3, 20, 13, 0, 7 and 10
(iii) 18, 19, 20, 23, 22, 20, 17, 19, 25 and 21
(iv) 3.6, 9.4, 3.8, 5.6, 6.5, 8.9, 2.7, 10.8, 15.6, 1.9 and 7.6.
Solution:
Question 22.
Find the mean and the mode for the following data :
Solution:
We prepare the table given below :
Question 23.
Find the mode of:
(i) 5, 6, 9, 13, 6, 5, 6, 7, 6, 6, 3
(ii) 7, 7, 8, 10, 10, 11, 10, 13, 14
Solution:
(i) Arranging the Numbers in ascending order : 3, 5, 5, 6, 6, 6, 6, 6, 7, 9, 13
Mostly repeated term = 6
∴ Mode = 6
(ii) Arranging the Numbers in ascending order = 7, 7, 8, 10, 10, 10, 11, 13, 14
Mostly repeated term =10
∴ Mode = 10
Question 24.
Find the mode of :
Solution:
(i) Since, the frequency of number 18 is maximum
∴Mode = 18
(ii) Since, the frequency of number 41 is maximum
∴ Mode = 41
Question 25.
The heights (in cm) of 8 girls of a class are 140,142,135,133,137,150,148 and 138 respectively. Find the mean height of these girls and their median height.
Solution:
Arranging in ascending order : 133, 135, 137, 138, 140, 142, 148, 150Here, number of girls = 8 which is even
Find the mean, the median and the mode of:
(i) 12, 24, 24, 12, 30 and 12
(ii) 21, 24, 21, 6, 15, 18, 21, 45, 9, 6, 27 and 15.
Solution:
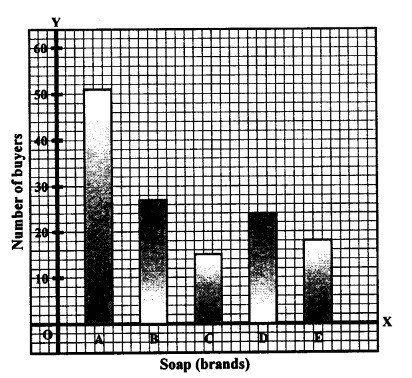
The following table shows the market positions of some brands of soap.
Draw a suitable bar graph :
Solution:
Question 28.
The birth rate per thousand of different countries over a particular period of time is shown below.
Solution:


